Ensuring Your Android App's Quality With Firebase Performance Monitoring
Firebase Performance Monitoring allows you to gather automatic performance data about your app, as well as performing manual performance traces for later analysis. All of these contain aggregated information about user’s devices, meaning long-term issues can be quickly identified and resolved.
This post is part of The Complete Guide to Firebase. Throughout this tutorial, you’ll need access to the Firebase Performance Monitoring dashboard, and the official documentation may be useful.
Implementation
As always, the entire Firebase Reference Project is open source, and there is a pull request for adding Firebase Performance Monitoring if you just want to see the code changes required. This tutorial assumes you already have Firebase added to your project.
In this tutorial, you’ll learn how to monitor the performance of your app, as well as benchmark specific scenarios across all users. You’ll also be able to track network requests, startup time, and how long your app was in the foreground.
Adding Performance Monitoring to your project
First, in your app-level build.gradle, just below apply plugin: 'com.android.application' add:
apply plugin: 'com.google.firebase.firebase-perf'
Still in the same file, add implementation 'com.google.firebase:firebase-perf:16.2.0' to your dependencies.
Next, in your project-level build.gradle, in the buildscript -> repositories section, make sure jcenter() is listed.
Finally, still in the same file, add the following inside buildscript -> repositories:
classpath 'com.google.firebase:firebase-plugins:1.1.5'
Perform a Gradle Sync, and your app’s performance + network requests are now being monitored!
Performing manual traces
Whilst app startup time, activity time, app background, and app foreground times are all measured automatically, you may wish to add your own time tracking.
This can be done in 2 ways:
First, specifying methods to always track via annotations. This is useful if you want to measure entire methods, don’t want to track custom metrics, and want to keep your actual functions short and clean. This is done by adding @AddTrace(name = "yourTraceName") before a method. For example, this function’s time is tracked under the trace name “automatic”:
@AddTrace(name = "automatic")
private fun performAutomaticTrace() {
    for (i in 1..(1..20).shuffled().last()) {
        Log.d("Performance", "Value is $i")
        sleep(100)
    }
}
The second method is manually starting a trace. This is used when you wish to modify the trace’s metadata whilst it is running, such as modifying custom attributes being tracked. These manual traces are started by creating a trace using FirebasePerformance.getInstance().newTrace("yourTraceName"), then starting it with .start(). The trace can then be stopped with .stop(). For example, this function’s time is tracked under the trace name “manual”:
private fun performManualTrace() {
    val trace = FirebasePerformance.getInstance().newTrace("manual")
    trace.start()
    for (i in 1..(1..10).shuffled().last()) {
        sleep(100)
    }
    trace.stop()
}
Monitor custom attributes
In addition to monitoring overall performance, you can also set and modify up to 5 custom attributes per trace. This can be useful for logging which code version an A/B tester is on. It can also be useful if you want to track how many times a user performs a specific action during the trace.
You must use the second method listed above (.newTrace()) to use custom attributes, as you need a reference to a trace. Once you have your reference, you can set a value using putAttribute(name, value):
trace.putAttribute("run_manual", true.toString())
This value can also be retrieved with trace.getAttribute(name) and removed with trace.removeAttribute(name).
Note that attributes are always stored as strings. However, if you wish to store numerical values you can use trace.incrementMetric(name, amount). This value can be retrieved with trace.getLongMetric(name), but cannot be deleted.
Web interface
Dashboard
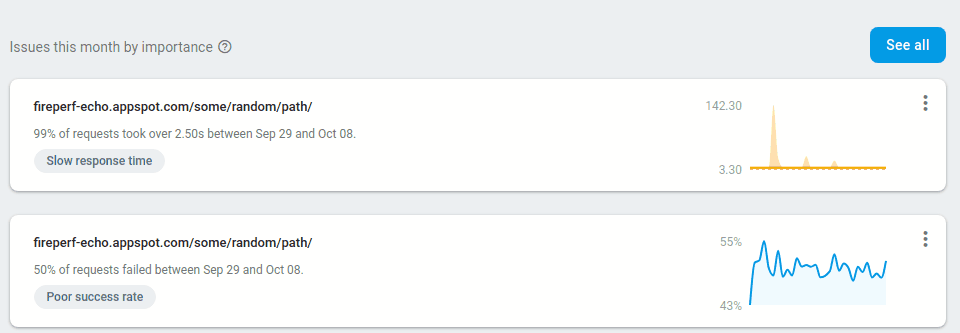
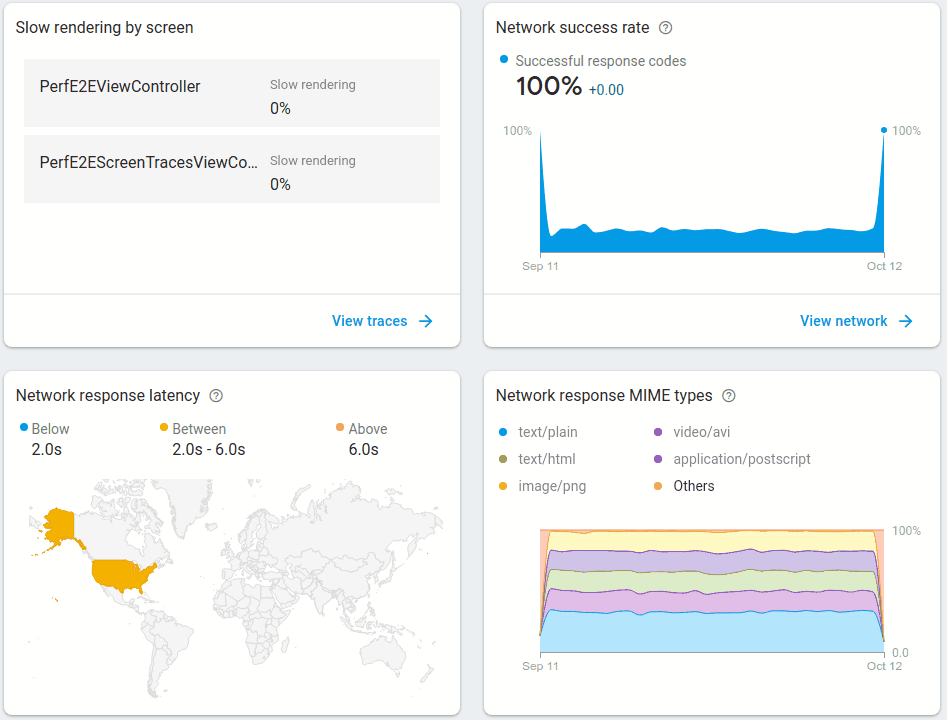
The dashboard provides an overview of any emerging issues that require attention, as well as any poorly performing screens and other important metrics.
| Issue list | More |
|---|---|
 |
 |
Clicking an issue will provide more information about it (similar to Crashlytics), as well as the option to close or mute the issue.
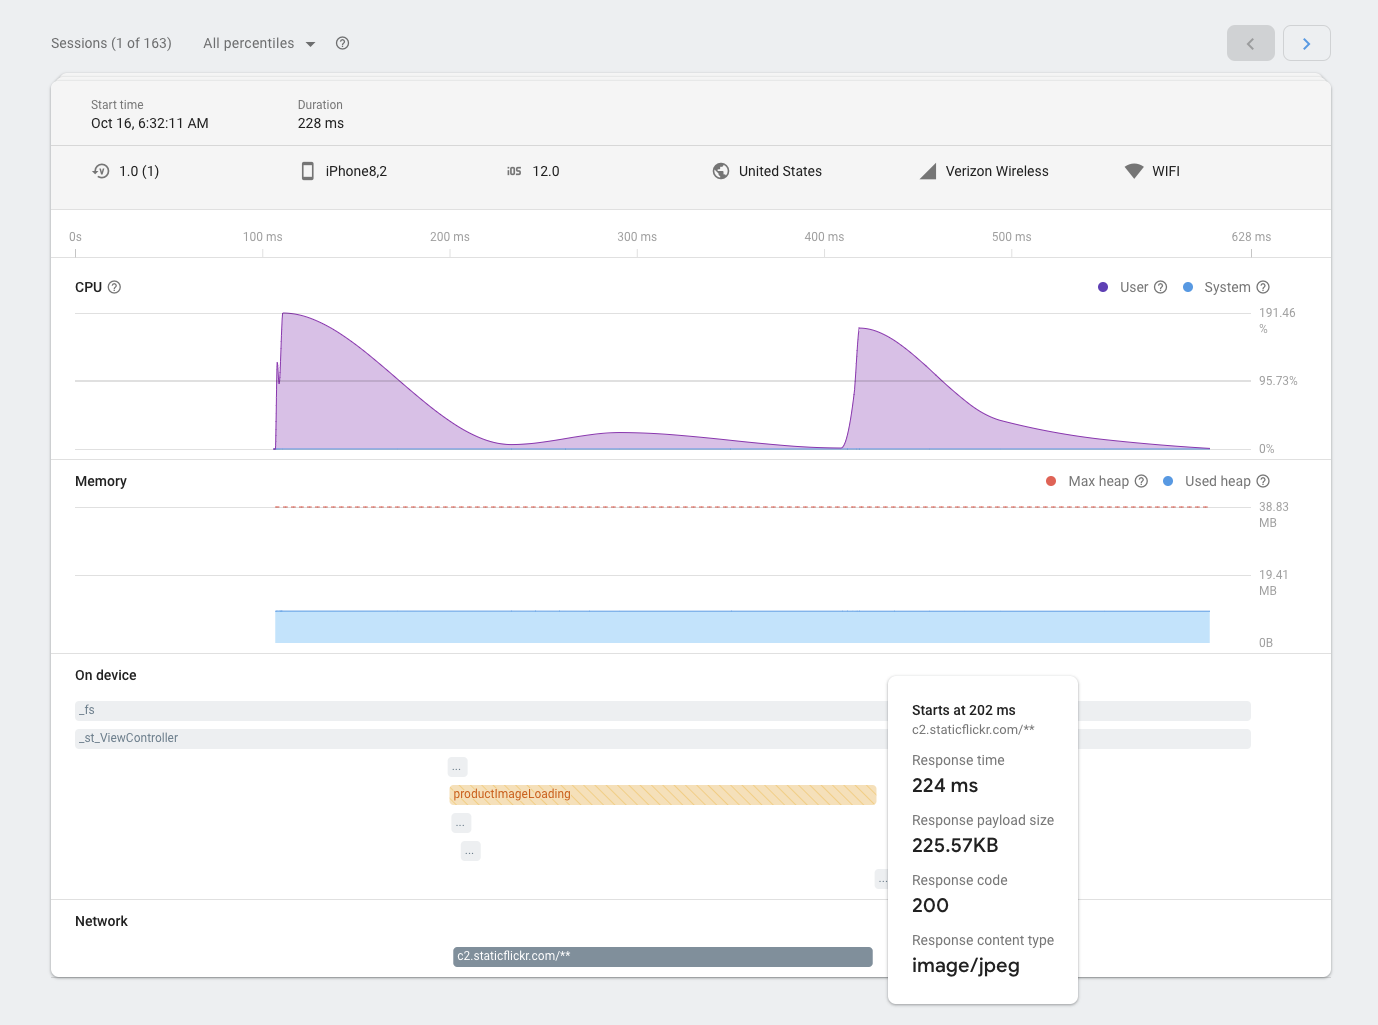
On device
The on device tab provides an overview of trace durations, both manual and automatic. Clicking any will provide a more detailed overview, as well as the option to view extremely detailed data for a specific session. This data is extremely useful when diagnosing issues like a memory leak or sluggish performance.
| Sessions | More sessions |
 |
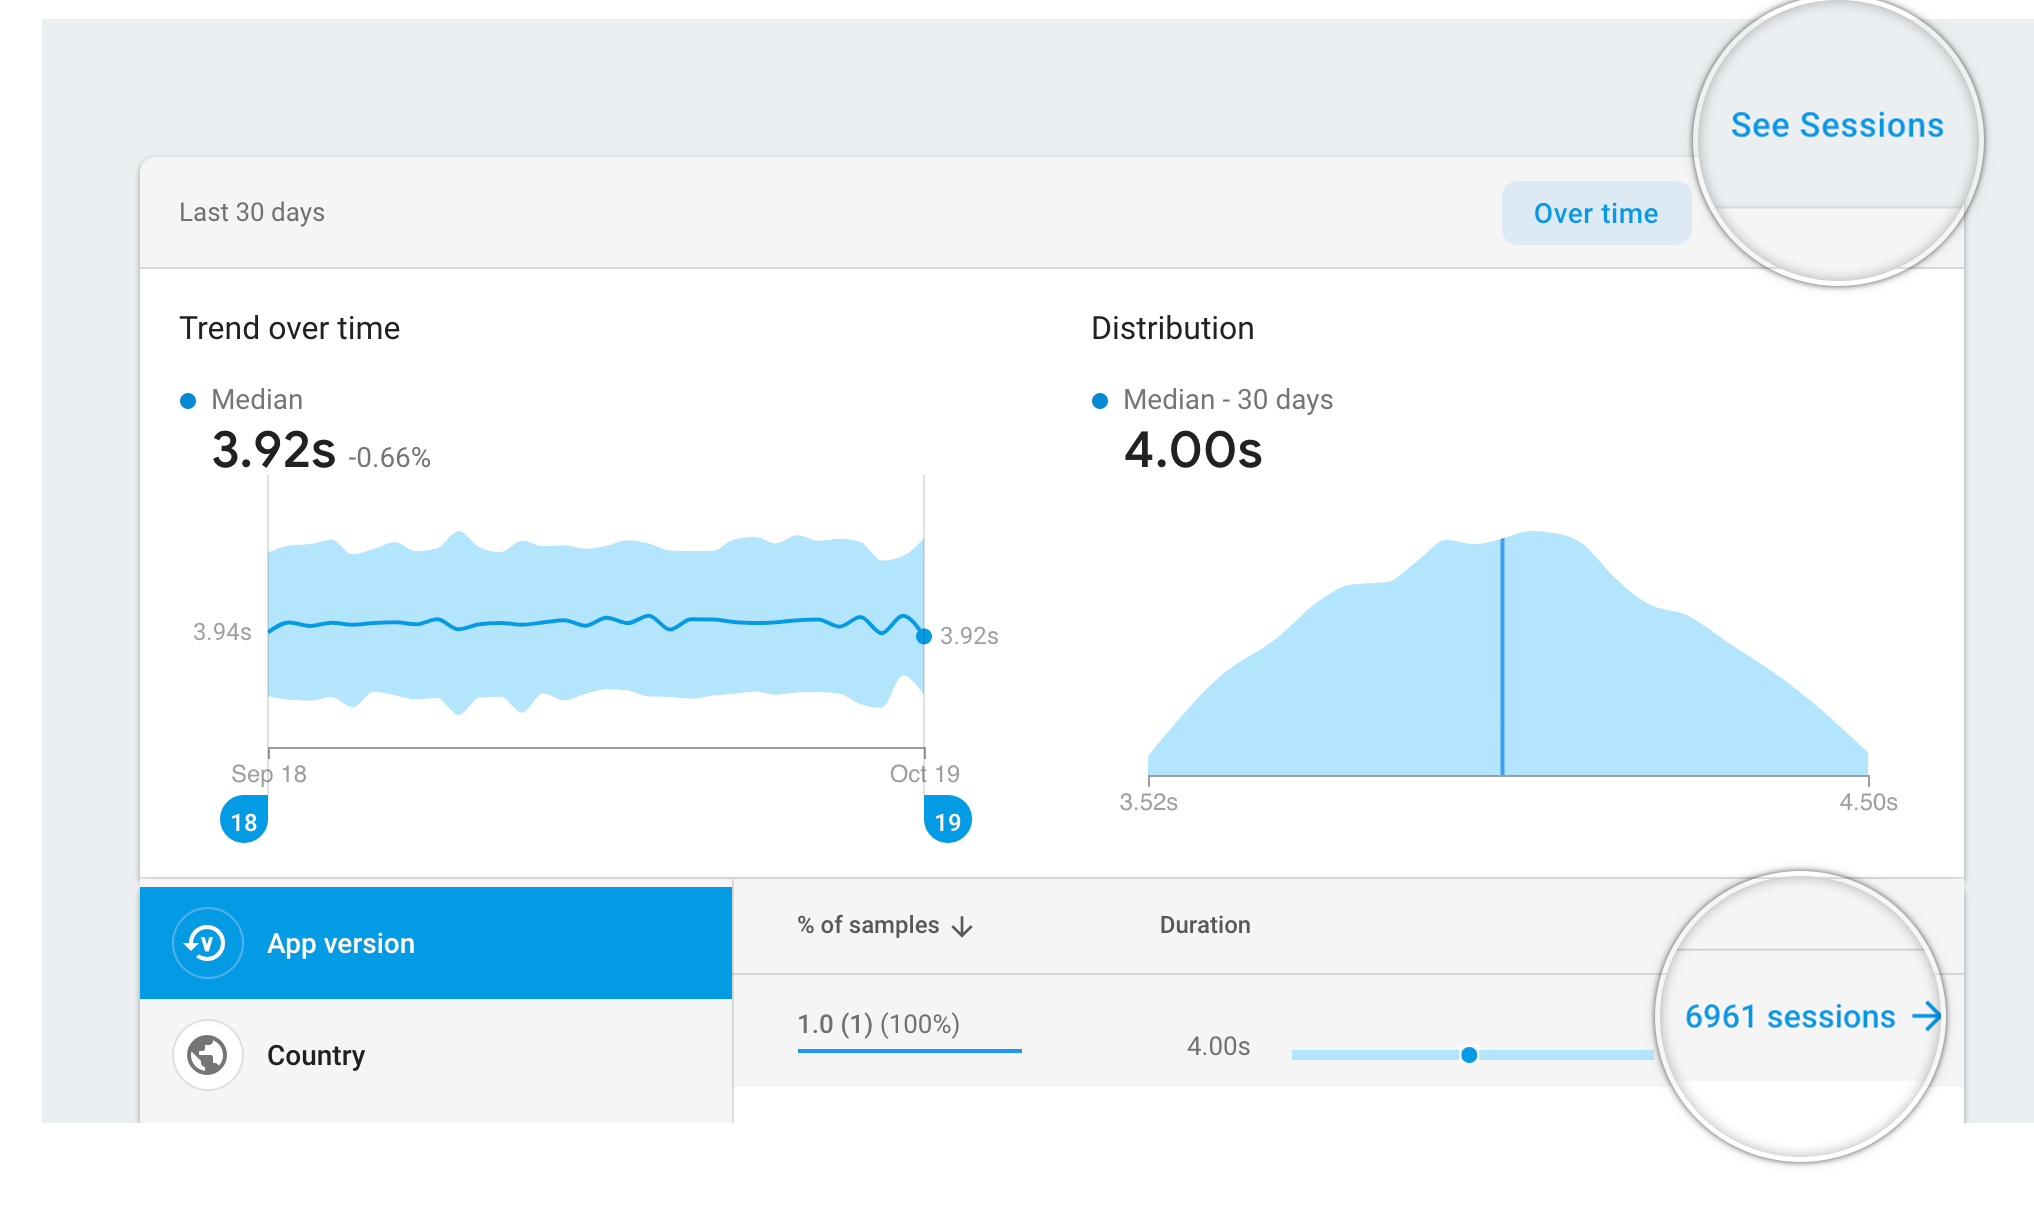 |
Network
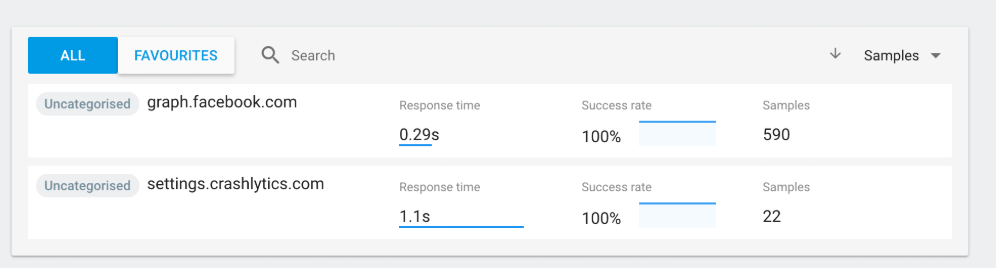
This tab shows information about network requests included in your traces, and is covered in detail in the official Firebase docs.
Conclusion
Whilst there is a slight risk of a performance overhead being added (somewhat ironically) when performing traces, this is usually outweighed by the benefits gained from knowing exactly how your app is performing. For example, if the median app start time has doubled after an update, without Firebase Performance Monitoring there wouldn’t be any way to know this! You could then track individual session and identify exactly what has changed since an earlier version.
Note that there are a few limitations with this method of performance monitoring. Most notably, only the main process can be monitored, meaning apps that make heavy use of threads or RxJava may end up with inaccurate reporting. Despite this, the service is free for unlimited usage, so is definitely worth including from the start on all apps. The collected data is then useful when attempting to optimise performance at a later date.
Previous: Ensuring Your Android App’s Quality With Firebase Crashlytics
Thanks to Firebase docs for some of the images used in this article.